
3D Multiplexed Cell Detection
Accurate segmentation of 3D multiplexed cells
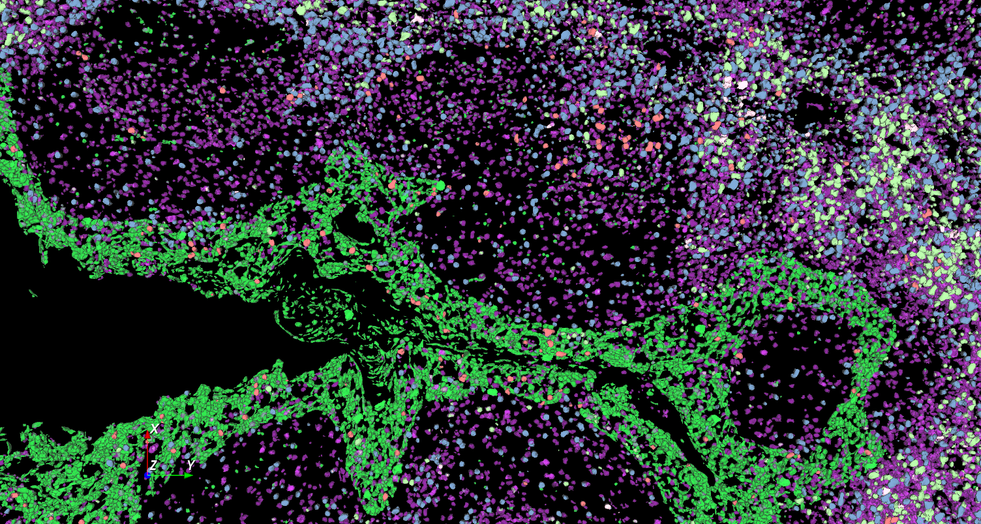
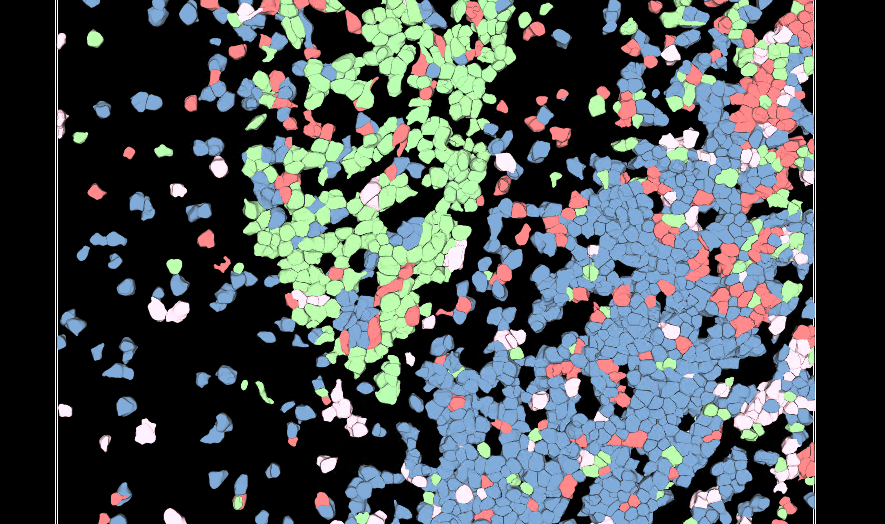
Discover our cutting-edge deep learning-powered 3D cell segmentation model designed to accurately segment multiplexed cells without the need for nuclear markers. Our enhanced model (modified from Cellpose [1]) effectively handles variations in cellular morphology, ensuring accurate detection and partitioning. It is also our fastest cell segmentation method ever, boasting a remarkable speed improvement of up to 78% compared to our previous methods. Leverage the power of artificial intelligence (AI) to gain profound insights faster, without the hassle of training your own deep learning models or coding your own solutions.
Experience the convenience of our free viewer, Aivia Community, allowing you to effortlessly share your discoveries with any collaborator, on any PC, anywhere in the world.
-
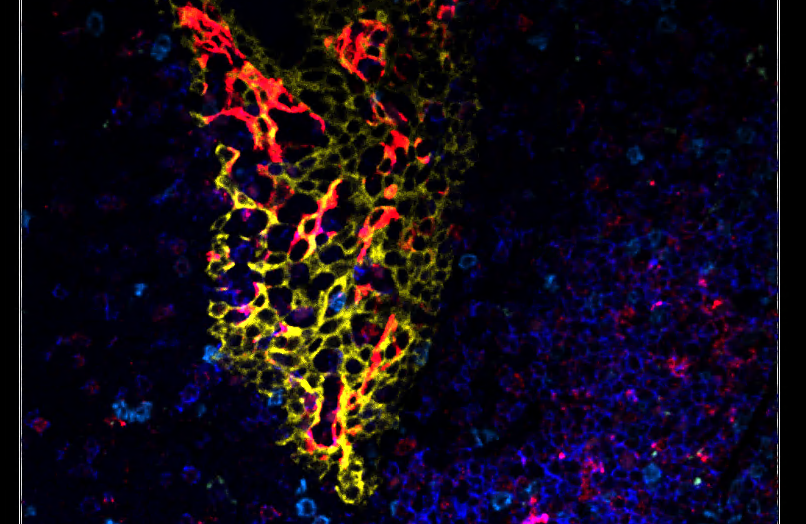
Accurately segment 3D cells using multiplexed membrane and cytoplasmic biomarkers without nuclear stains
-
Boost your research with our lightning-fast cell segmentation, accelerating your path to insights
-
Seamlessly share your groundbreaking insights with anyone, anywhere, on any PC workstation using Aivia Community
1. Stringer C, Wang T, Michaelos M, and Pachitariu M. Cellpose: a generalist algorithm for cellular segmentation. Nature Methods. 18: 100-106. (2021)
Media Gallery

Effortless Cell Classification
Expert- or data-driven phenotyping made simple
Our Phenotyper harnesses the power of artificial intelligence to build classifiers based on your expert knowledge of cell phenotypes in 2D or 3D images. Simply select a few representative cells, and Aivia will automatically classify cells into different phenotypes.
Aivia 13 introduced two unsupervised automatic phenotyping methods, k-means clustering [2] and PhenoGraph-Leiden clustering [3], which are now fully supported for 3D images (widefield, confocal, 3D multiplexed up to 15 channels, 2D multiplexed up to 30 channels). With just a few user-selected parameters, you can utilize multiple intensity and/or morphological measurements to automatically classify cells.
With Aivia 14, you can take your phenotyping a step further by classifying a phenotype using any of the four available object classifier methods in Aivia. This empowers you to perform deeper investigations using various intensity or morphological measurements. Each classified object has a confidence value for the assigned class, allowing you to remove low-confidence objects during quality control or select only the highest-confidence objects for subsequent phenotyping or downstream analysis.
-
Empower your research with the Phenotyper, leveraging your expertise through AI
-
Achieve automatic clustering using k-means or PhenoGraph-Leiden methods based on intensity and/or morphological measurements
-
Enhance your analysis by further sub-classifying phenotypes using any classifier method available in Aivia
2. MacQueen, J. Some methods for classification and analysis of multivariate observations. Proceedings of the 5th Berkeley Symposium on Mathematical Statistics and Probability. Vol. 1: Statistics. 281-297. (1967).
3. Traag VA, Waltman L, and van Eck NJ. From Louvain to Leiden: guaranteeing well-connected communities. Scientific Reports. 9: 5233. (2019).
Media Gallery

Biomarker Grouping
Group Biologically Relevant Channels for Enhanced Visualization and Interpretation
Effortlessly visualize biologically relevant channels together in complex multiplexed data by grouping related biomarkers. This allows for easy toggling of multiple channels at once. Automatically populate Phenotyper classes and channels with biologically relevant channels and leverage functional groupings for data interpretation using the Marker-Cluster Dendrogram to explore the relationship between biomarkers and phenotypes.
-
Group related biomarkers (e.g. tumor -markers, immune cell markers) for cohesive visualization in multiplexed 3D images
-
Automatically import classes and related biomarkers into Phenotyper based on biologically relevant channel groupings
-
Leverage functional groupings for a comprehensive understanding of complex multiplexed data using the Marker-Cluster dendrogram
Media Gallery

Complex Spatial Data Exploration
Innovative visualization techniques for enhanced data analysis and spatial relationships
Aivia 14 provides you with novel tools to explore and visualize complex data and spatial relationships, whether it is 2D or 3D multiplexed data or routine confocal images with multiple morphological measurements. Here are key features for higher-level understanding of complex data:
-
Automatic generation of summary statistics during phenotyping to showcase counts and percentage distributions
-
The Marker-Cluster Dendrogram reveals the relationship between intensity or morphological measurements and phenotypes with enhanced interactivity for exploration of clusters, channels, and morphological measurements of interest within the image viewer
-
Sorting of measurements per cluster or clusters per measurement for effortless interpretation of intricate data
-
A new double-sided Violin plot for comparing data distribution between two measurements in different object groups or phenotypes
-
A Pearson Correlation Heatmap to visualize correlations between two measurements in different object groups or phenotypes
-
Binned scatterplot for comprehensive data distribution analysis of two different measurements across different objects or phenotypes
-
Dimensionality reduction techniques (UMAP, PacMAP, t-SNE) for simplifying high-dimensional data into a two-dimensional space, facilitating data interpretation
-
Multi-well scatterplot to plot data per well, per experimental condition, or for all conditions across the entire plate
Additionally, our Relation Tool enables accurate vertex-to-vertex 3D distance measurements between individual objects or phenotypes by interactively selecting objects or phenotypes on the image and visualization of the selection using the Spotlight feature
-
The updated Marker-Cluster Dendrogram offers enhanced interactivity for effortless visualization of complex data
-
The two-sided Violin plot provides an insightful visualization tool for comparing two measurements within phenotypes or object sets
-
All chartng functions in Aivia, including Binned Scatterplot, Dimensionality Reduction, Violin plot, Pearson Correlation Heatmap, and Multi-well Scatterplot, are now fully compatible with 2D and 3D multiplexed data
-
Perform 3D spatial analysis (nearest neighbor, overlap) for cells and phenotypes of interest


